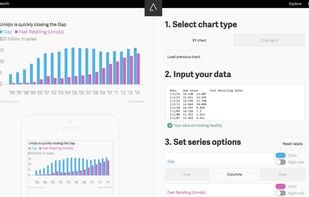
Charted Alternatives

Charted is described as 'Tool that automatically visualizes data. Give it the link to a data file and Charted returns a beautiful, shareable visualization of that data. It's free and open-source, brought to you by the folks at Medium' and is an app in the office & productivity category. There are more than 10 alternatives to Charted for a variety of platforms, including Web-based, Mac, Windows, Linux and iPhone apps. The best Charted alternative is Plotly, which is both free and Open Source. Other great apps like Charted are Google Charts, Koia, Squey and Visualis.

Copy a direct link to this comment to your clipboard
Charted alternatives page was last updated

Alternatives list

  1. Google Charts icon
     28 likes

    The Google Charts is an extremely simple tool that lets you easily create a chart from some data and embed it in a webpage. You embed the data and formatting parameters in an HTTP request, and Google returns a PNG image of the chart.

    Cost / License

    • Free
    • Proprietary

    Application type

    Platforms

    • Online
     
  2. Koia icon
     4 likes

    Create graphs online with CSV, Excel or JSON data. Choose from different chart types, pivot tables and relationship graphs. Easy, user-friendly, open- source.

    Cost / License

    • Free
    • Open Source (MIT)

    Application type

    Platforms

    • Online
    • Self-Hosted
     
  3. Squey icon
     2 likes

    Squey is an open-source visualization software designed to interactively explore and understand large amounts of tabular data.

    Cost / License

    • Free
    • Open Source (MIT)

    Platforms

    • Windows
    • Linux
    • Amazon Web Services
    • Flathub
    • Software as a Service (SaaS)
    • Flatpak
    • Mac
     
  4. Visualis icon
     3 likes

    Visual.is was founded on the belief that by maximizing the visual impact of your data, you can transform your business. We are experienced designers and programmers who believe in the value of beautiful information design.

    Cost / License

    • Freemium
    • Proprietary

    Platforms

    • Online
     
  5. Statpedia icon
     23 likes

    Create a chart in just moments with one of the simplest chart creation tools.

    Cost / License

    • Free
    • Proprietary

    Platforms

    • Online
     
  6. ZoomCharts icon
     6 likes

    The world's most interactive data visualization software. Supercharged touch-screen enabled HTML5 Graph and Chart library, written in fast cross-platform JavaScript, runs in all browsers.

    Cost / License

    • Paid
    • Proprietary

    Platforms

    • Online
     
  7. ChartBlocks icon
     8 likes

    ChartBlocks is an online software platform that lets you quickly and easily build embeddable, shareable charts.

    Cost / License

    • Free
    • Proprietary

    Application type

    Platforms

    • Online
     
  8. Atlas charts icon
     1 like

    Atlas gives each chart its own home, along with a set of tools for interacting with them: You can download the data behind the charts, embed them elsewhere on the web, grab an image, and of course share them on social media.

    Cost / License

    • Free
    • Proprietary

    Platforms

    • Online
     
  9. FusionCharts Suite XT helps you create interactive JavaScript charts, gauges and maps in a jiffy for all your web, mobile and enterprise applications. Using it, you can build awesome dashboards, reports, analytics, monitors, surveys that blend aesthetic elegance and actionable...

    Cost / License

    • Paid
    • Proprietary

    Platforms

    • Mac
    • Windows
    • Linux
    • Online
    • Android
    • iPhone
    • Blackberry
    • Android Tablet
    • iPad
     
  10. ChartURL icon
     11 likes

    An Alternative to Google Image Charts that enables developers and marketers to embed personalized charts in their emails, Slackbots, web/mobile apps, and more.

    Cost / License

    • Freemium
    • Proprietary

    Platforms

    • Online
    • Self-Hosted
     
  11. KoolChart icon
     1 like

    Koolcharts provides charting solutions with full HTML5 support. It renders data using a number of sliding effects, you can choose whichever effect you want and set an amount of time for a sliding effect.

    Cost / License

    • Paid
    • Proprietary

    Platforms

    • Online
    • JavaScript
     
12 of 13 Charted alternatives