
Coroot
Like
Coroot is an open-source observability and APM tool with AI-powered Root Cause Analysis. It combines metrics, logs, traces, continuous profiling, and SLO-based alerting with predefined dashboards and inspections.
Cost / License
- Freemium (Subscription)
- Open Source (Apache-2.0)
Application type
Platforms
- Self-Hosted
- Docker
- Kubernetes
- Online
- Software as a Service (SaaS)

Features
- Ad-free
- Dark Mode
- Error Logging
- AI-Powered
- Database Monitoring
Tags
- Observability
- ai-observability
- ebpf
- data-observability
Coroot News & Activities
Highlights All activities
Recent activities
- POX added Error Logging as a feature to Coroot
 POX added Coroot as alternative to Visual QMS, Solvonext NCR, FireHydrant and Root Cause Plus
- POX added Coroot

Coroot information
Developed by
Coroot Inc.Licensing
Open Source (Apache-2.0) and Freemium product.Pricing
Subscription that costs $1 per month + free version with limited functionality.Written in
Alternatives
27 alternatives listedSupported Languages
- English


No comments or reviews, maybe you want to be first?
What is Coroot?
Collecting metrics, logs, and traces alone doesn't make your applications observable. Coroot turns that data into actionable insights for you!
Features:
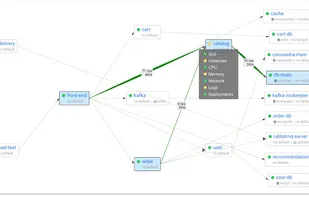
Zero-instrumentation observability
- Metrics, logs, traces, and profiles are gathered automatically by using eBPF
- Coroot provides you with a Service Map that covers 100% of your system with no blind spots
- Predefined inspections audit each application without any configuration
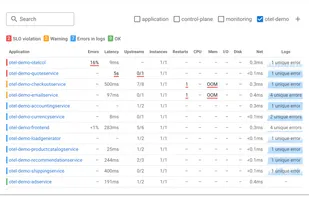
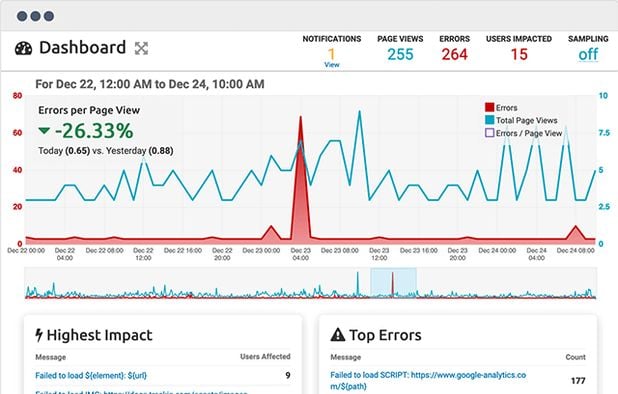
Application Health Summary
- Easily understand the status of your services, even when dealing with hundreds of them
- Gain insight into application logs without the need to manually inspect each one
- SLOs (Service Level Objectives) tracking
Explore any outlier requests with distributed tracing
- Investigate any anomaly with just one click
- Vendor-neutral instrumentation with OpenTelemetry
- Are you unable to instrument legacy or third-party services? Coroot's eBPF-based instrumentation can capture requests without requiring any code changes.
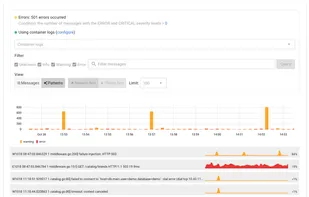
Grasp insights from logs with just a quick glance
- Log patterns: out-of-the-box event clustering
- Seamless logs-to-traces correlation
- Lightning-fast search based on ClickHouse
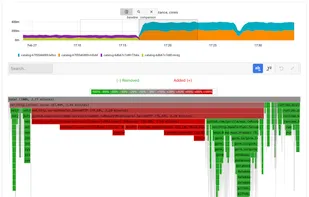
Profile any application in 1 click
- Analyze any unexpected spike in CPU or memory usage down to the precise line of code
- Don't make assumptions, know exactly what the resources were spent on
- Easily investigate any anomaly by comparing it to the system's baseline behavior
Built-in expertise
- Coroot can automatically identify over 80% of issues
- If an app is not meeting its Service Level Objectives (SLOs), Coroot will send a single alert that includes the results of all relevant inspections
- You can easily adjust any inspection for a particular application or an entire project
Deployment Tracking
- Coroot discovers and monitors every application rollout in your Kubernetes cluster
- Requires no integration with your CI/CD pipeline
- Each release is automatically compared with the previous one, so you'll never miss even the slightest performance degradation
- With integrated Cost Monitoring, developers can track how each change affects their cloud bill
Cost Monitoring
- Understand your cloud costs down to the specific application
- Doesn't require access to you cloud account or any other configurations
- AWS, GCP, Azure