

Dataello
Dataello is a data visualization tool that turns spreadsheets into stunning, interactive charts. Create professional visualizations in seconds — no design skills or coding required.
Cost / License
- Freemium (Subscription)
- Proprietary
Platforms
- Online

Features
- Data visualization
- Charts
Tags
- charts-and-visualization
Dataello News & Activities
Recent activities
- rafalrybnik added Dataello
- POX updated Dataello
 rafalrybnik added Dataello as alternative to Flourish and Graph Online
Dataello information
Licensing
Proprietary and Freemium product.Pricing
Subscription that costs $10 per month + free version with limited functionality.Alternatives
2 alternatives listedSupported Languages
- English


What is Dataello?
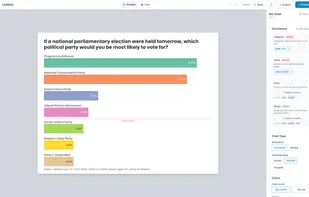
Dataello is an online tool for creating beautiful, interactive data visualizations. Turn spreadsheets into professional charts in seconds — no design skills or coding required.
Key Features:
- 20+ chart types — bar, line, pie, scatter, treemap, sankey, and more
- Paste & visualize — import data directly from Excel or Google Sheets
- Full customization — colors, fonts, labels, legends, annotations
- Free exports — download as PNG, JPEG, SVG, HTML
- Publish & embed — share interactive charts via link or embed them anywhere
- Mobile-friendly — published charts work on any device
Who it's for:
- Researchers presenting survey results
- Marketers building reports and presentations
- Journalists creating data stories
- Students and educators visualizing data
- Anyone who needs clean charts without the complexity
Why Dataello?
Most data visualization tools either lock essential features behind expensive subscriptions or require technical expertise. Dataello is different: it's simple enough for beginners yet powerful enough for professionals — and core features like exporting are completely free.
Built by a researcher with 10+ years of experience in market research and election polling, Dataello focuses on what matters: getting from raw data to a polished chart as fast as possible.