
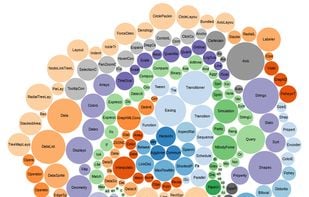
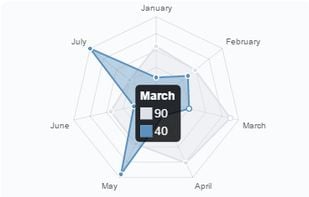
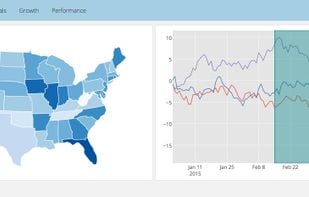
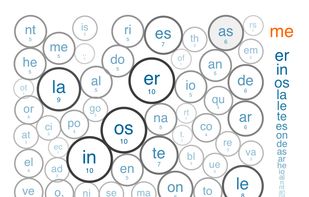
D3.js is a JavaScript library for manipulating documents based on data. D3 helps you bring data to life using HTML, SVG, and CSS.
+6


Essential JS 2 for JavaScript by Syncfusion is described as 'The Syncfusion JavaScript UI controls library is the only suite that you will ever need to build an application since it contains over 60 high-performance, lightweight, modular, and responsive UI components in a single package' and is an app in the office & productivity category. There are more than 50 alternatives to Essential JS 2 for JavaScript by Syncfusion for a variety of platforms, including Web-based, Self-Hosted, Windows, Mac and Linux apps. The best Essential JS 2 for JavaScript by Syncfusion alternative is D3.js, which is both free and Open Source. Other great apps like Essential JS 2 for JavaScript by Syncfusion are RAWGraphs, Semantic UI, Chart.js and Plotly.
D3.js is a JavaScript library for manipulating documents based on data. D3 helps you bring data to life using HTML, SVG, and CSS.

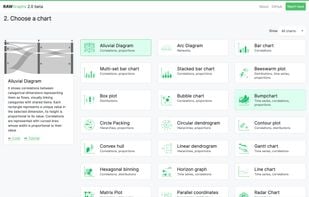
RAWGraphs is an open source app built with the goal of making the visualization of complex data easy for everyone. Born as tool for designers and vis geeks, RAWGraphs aims at providing a missing link between spreadsheets and vector graphics editors.


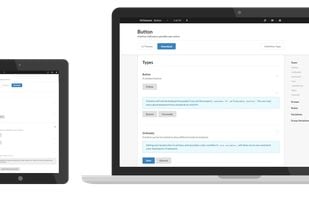
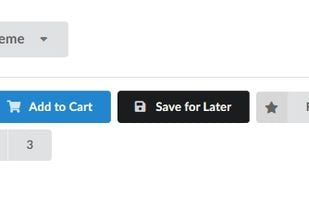
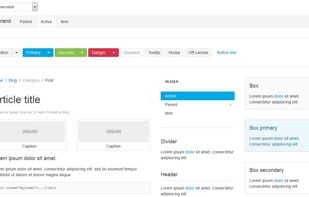
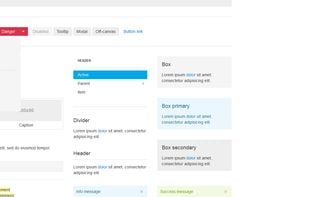
UI framework with 50+ elements and 3000+ CSS variables, ensuring responsive design. Seamlessly integrates with React, Angular, and other frameworks for customizable theming.


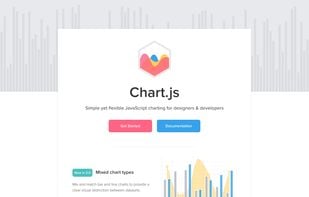
Easy, object oriented client side graphs for designers and developers. Open source HTML5 charts using the canvas tag. Chart.js is an easy way to include animated graphs on your website.

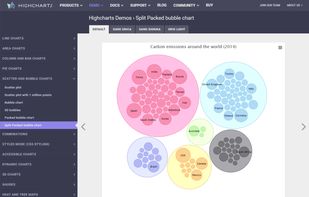
Plotly is the easiest way to graph and share data online. Open-source libraries for JavaScript (comparison with HighCharts at https://plot.ly/highcharts-alternative/), Python, R, and MATLAB.


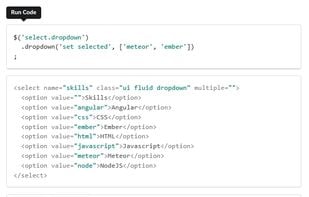
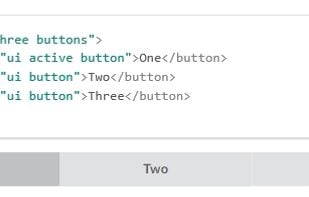
A lightweight and modular front-end framework for developing fast and powerful web interfaces.


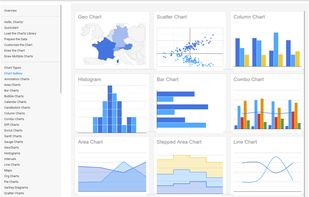
The Google Charts is an extremely simple tool that lets you easily create a chart from some data and embed it in a webpage. You embed the data and formatting parameters in an HTTP request, and Google returns a PNG image of the chart.


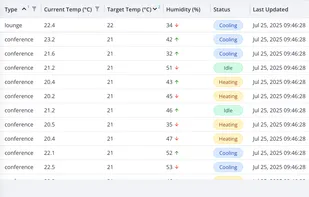
A standalone, lightweight JavaScript DataGrid component designed for quick setup, fast data handling, and essential features like advanced sorting, filtering, editing, in-built charts, subrows and subviews and more.


Processing.js is an open programming language, port of the Processing Visualization Language, for people who want to program images, animation, and interactions for the web without using Flash or Java applets. Processing.


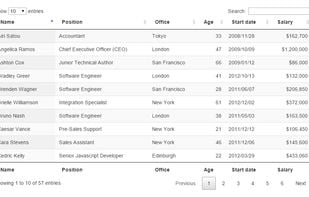
DataTables is a plug-in for the jQuery Javascript library. It is a highly flexible tool, based upon the foundations of progressive enhancement, and will add advanced interaction controls to any HTML table.


Highcharts is a charting library written in pure JavaScript, offering an easy way of adding interactive charts to your web site or web application. Highcharts currently supports line, spline, area, areaspline, column, bar, pie and scatter chart types.


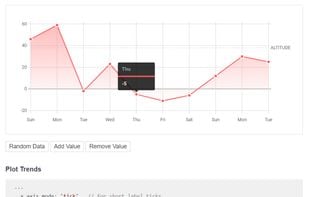
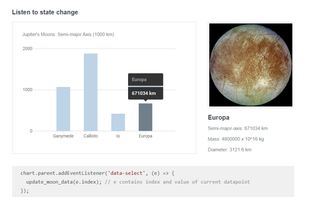
Frappé Charts is a simple, responsive, modern charts library for the web with zero dependencies and a roughly 15k gzipped file size. From the makers of ERPNext, the library offers a fast alternative with minimal effort needed to visualize data in sleek charts.