

ExpenseOwl
16 likes
An expense tracker with a minimalist UI, visualizes monthly spending in pie charts. Supports UUID identification, flat file storage, CSV export, REST API, and Docker deployment. Customize categories and currency, ideal for personal finance in a home lab setup.

Features
Properties
- Privacy focused
Features
- Ad-free
- No Tracking
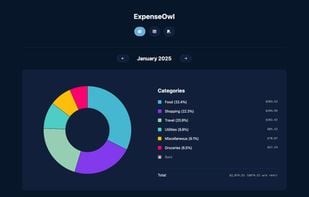
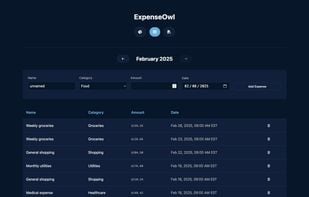
- Dark Mode
- Support for multiple currencies
- Expense Tracking
- Data visualization
- REST API
- Export to CSV
ExpenseOwl News & Activities
Highlights All activities
Recent News
No news, maybe you know any news worth sharing?
Share a News TipRecent activities
 POX added ExpenseOwl as alternative to Savvy Expense Pro
 jddavid added ExpenseOwl as alternative to EZer app
 BitMavrick1 added ExpenseOwl as alternative to SaveUp – Track & Save Money
 POX added ExpenseOwl as alternative to Am I Good?
 juldev added ExpenseOwl as alternative to Danalyse
 gray_lama added ExpenseOwl as alternative to Finn - Financial Tracker and Ivy Wallet
- pi_hacker liked ExpenseOwl
 WildThing added ExpenseOwl as alternative to Maxim Money
 POX added ExpenseOwl as alternative to Budget Board
 expensinator added ExpenseOwl as alternative to Expensinator
ExpenseOwl information
Developed by
TanishqLicensing
Open Source (MIT) and Free product.Alternatives
59 alternatives listedSupported Languages
- English
AlternativeTo Categories
Business & Commerce, DevelopmentGitHub repository
- 1,342 Stars
- 108 Forks
- 35 Open Issues
- Updated


No comments or reviews, maybe you want to be first?
What is ExpenseOwl?
ExpenseOwl is an extremely simple expense tracking system with a modern monthly pie-chart visualization. It tracks daily expenses, visualizes monthly spending patterns, and maintains an overview of financial habits.
Core Functionality:
- Simple expense tracking with essential details only (optional name, date without time, amount, and category)
- UUID-based expense identification in the backend
- Flat file storage system (data/expenses.json)
- Multi-architecture Docker container with support for persistent storage
- REST API for expense management
- Single-user focused (mainly for a home lab deployment)
- CSV export of all expense data from the UI
- CLI for both server and client (if needed) operations
- Custom categories via environment variable (EXPENSE_CATEGORIES) with sensible defaults
- Custom currency symbol in the frontend via environment variable (CURRENCY)
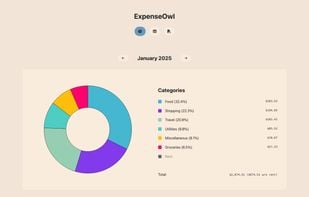
Visualization:
- Dashboard with expense category breakdown (pie chart)
- Click on a category to exclude it from the graph, click again to add it back
- This helps visualize the breakdown without considering some categories like Rent
- The legend shows the total expenditure of the month along with the total without the "Rent" category
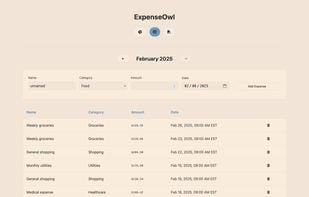
- Table view for detailed expense listing
- This is where you can view individual expenses chronologically and delete them
- You can use the browser's search to find a name if needed
- Month-by-month navigation