
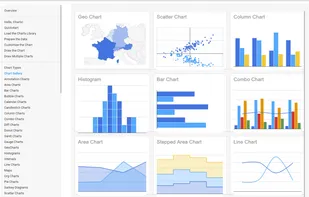
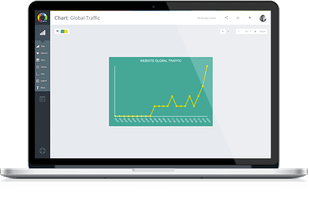
The Google Charts is an extremely simple tool that lets you easily create a chart from some data and embed it in a webpage. You embed the data and formatting parameters in an HTTP request, and Google returns a PNG image of the chart.


Comments about Google Charts as an Alternative to Infogr.am

- Google Charts is Free and Proprietary


You need to know how to code