Tableau helps the world’s largest organizations unleash the power of their most valuable assets: their data and their people.
Cost / License
- Paid
- Proprietary
Application type
Platforms
- Mac
- Windows
- Online
- Self-Hosted
+9


Izenda is described as 'NET-based embedded business intelligence platform for ISVs and solutions providers. Our reports, dashboards and visualizations blend seamlessly into your application so you can quickly deploy BI to your customer base' and is a business intelligence tool in the business & commerce category. There are more than 10 alternatives to Izenda for a variety of platforms, including Web-based, SaaS, Windows, iPhone and Self-Hosted apps. The best Izenda alternative is Tableau. It's not free, so if you're looking for a free alternative, you could try Zoho Analytics or QueryTree. Other great apps like Izenda are QlikView, Marple Insight, Sisense and dotnet Report Builder.
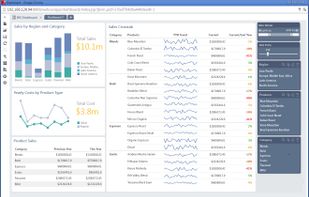
Tableau helps the world’s largest organizations unleash the power of their most valuable assets: their data and their people.

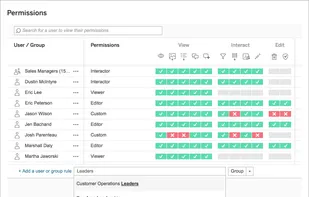
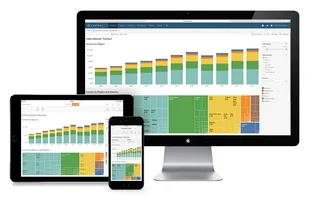
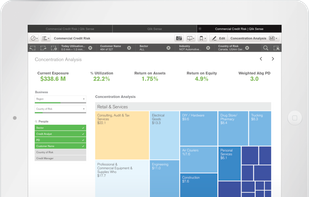
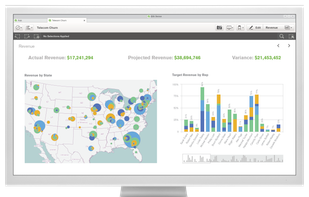
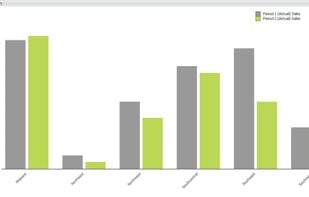
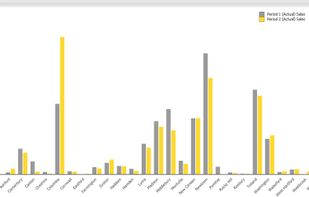
Create insightful reports & dashboards, Visually analyze your business information. Easily create insightful reports & dashboards using a drag and drop interface. No IT help required.

QlikView is Qlik’s classic analytics solution for rapidly developing highly-interactive guided analytics applications and dashboards, delivering insight to solve business challenges.


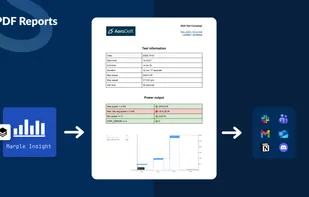
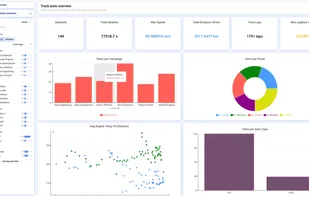
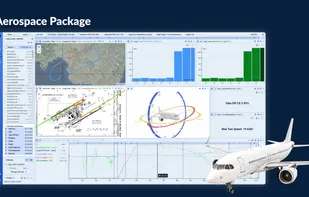
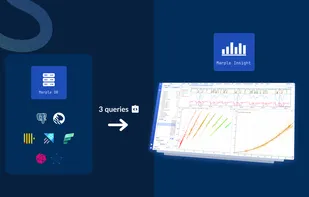
Marple Insight offers powerful tools for interactive analysis of high-frequency time-series data. Engineers and scientists from automotive, aerospace and manufacturing use it to explore, visualise, and analyse sensor or test data.

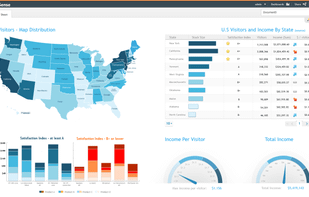
Sisense is a business intelligence and data analytics software that lets non-techies join, analyze, and visualize multiple large data sets in interactive dashboards.


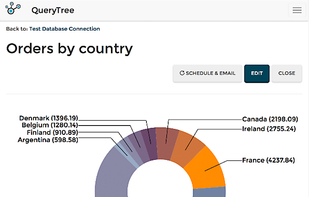
QueryTree is a flexible and powerful database reporting tool. Simply connect your database and start visualizing your data in minutes. Everything works with a dropdown menu interface - no code or SQL needed.


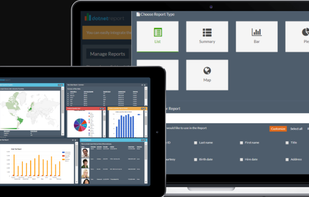
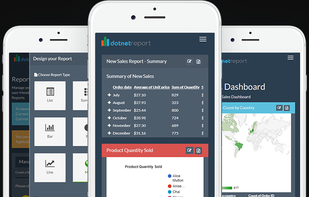
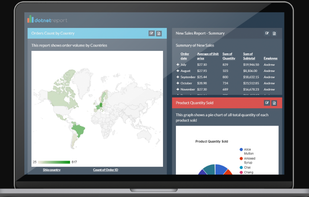
dotnet Report is a Report Building software to help other programmers easily add a friendly and intuitive Report Designer in their own software so that their end users can design their own Reports, Dashboards and Charts with ease.


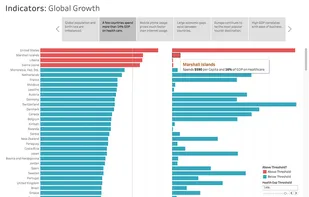
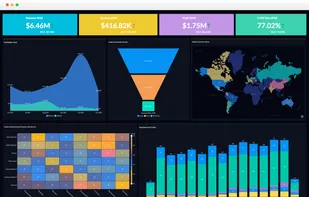
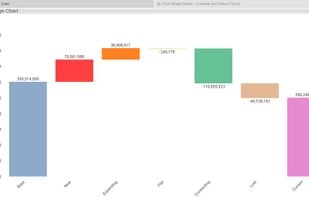
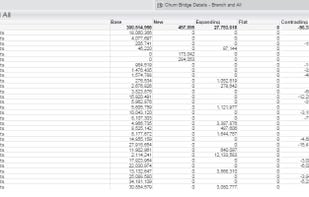
Enterprise-caliber BI delivers accurate, actionable content in an intuitive, self-service environment. It allows users to combine data from different source systems to get answers to their most pressing business concerns in real time.


Our approach blends proprietary metrics and frameworks, smart Business Intelligence software, insightful analytics, and creative problem-solving to help businesses achieve their bottom-line goals.


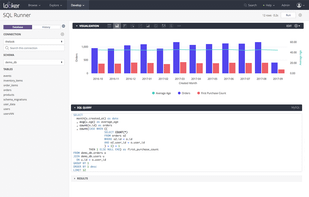
Looker gives you access to your organization’s data. Many users start by browsing through the reports - which we call “Looks” - and dashboards that others in their organization have already created. This page will show you how to get started browsing.


Tercept automatically aggregates and organizes all monetization data,analytics data and marketing data into one single dashboard with powerful querying and visualization capabilities. You can setup custom reports and automate 100% of your reporting.


Jinfonet Software provides the JReport product suite, a Java reporting solution that delivers highly customizable business intelligence. JReport's sophisticated reporting engine seamlessly embeds into any application and empowers end users to make better business decisions...