
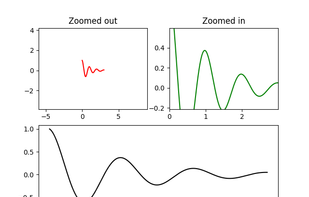
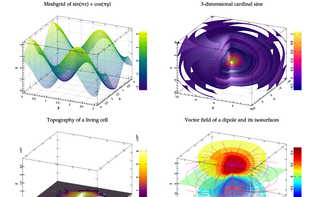
Matplotlib is a comprehensive library for creating static, animated, and interactive visualizations in Python. Matplotlib makes easy things easy and hard things possible.
Cost / License
- Free
- Open Source
Platforms
- Mac
- Windows
- Linux
- Python
- BSD
+1


Lybniz is described as 'Simple and very easy to use mathematical function graph plotter written in Python and GTK. Expressions are entered in Python syntax' and is an app in the development category. There are more than 25 alternatives to Lybniz for a variety of platforms, including Windows, Mac, Linux, iPad and Flathub apps. The best Lybniz alternative is Matplotlib, which is both free and Open Source. Other great apps like Lybniz are GeoGebra, GnuPlot, OriginPro and Graph.
Matplotlib is a comprehensive library for creating static, animated, and interactive visualizations in Python. Matplotlib makes easy things easy and hard things possible.
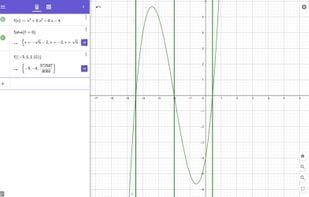
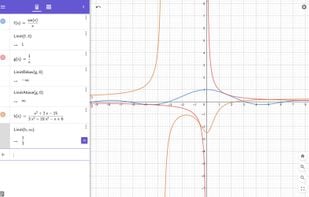
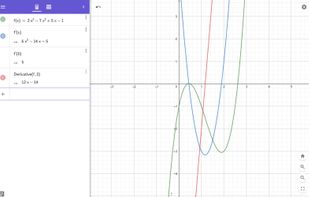
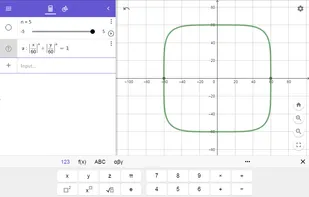
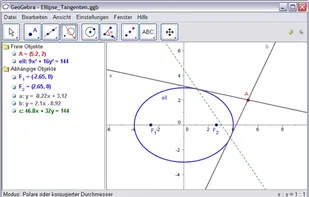
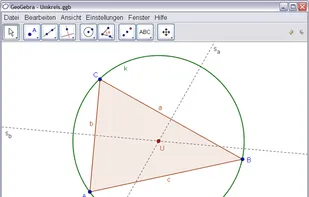
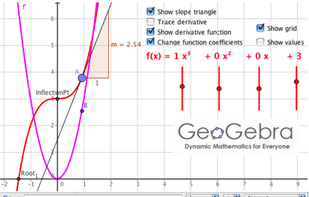
GeoGebra is free and multi-platform dynamic mathematics software for learning and teaching. It has received several educational software awards in Europe and the USA.

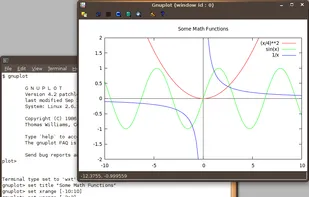
Gnuplot is a portable command-line driven interactive data and function plotting utility. It was originally intended as to allow scientists and students to visualize mathematical functions and data. It does this job pretty well, but has grown to support many non-interactive...

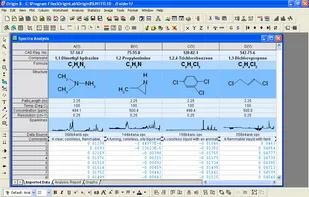
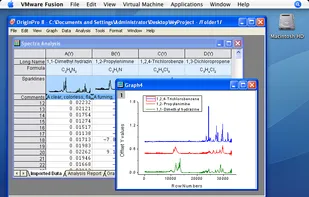
Data analysis and graphing software for scientists and engineers. It provides You with dozens of functionalities and options. The plotting engine is very effective and the plots are of high quality. A lot of statistical functionalities make data analysis very easy even for those...


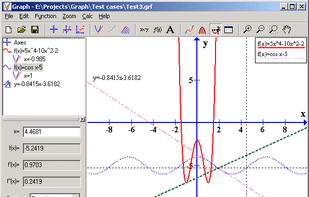
Graph is an open source application used to draw mathematical graphs in a coordinate system. Anyone who wants to draw graphs of functions will find this program useful. The program makes it very easy to visualize a function and paste it into another program.

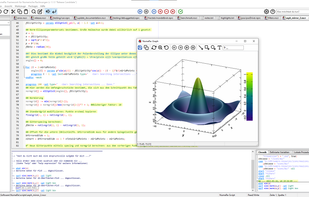
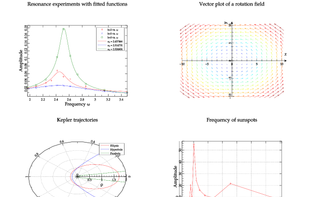
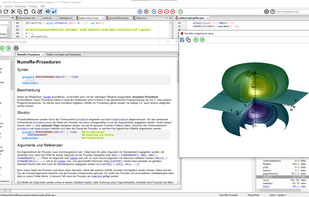
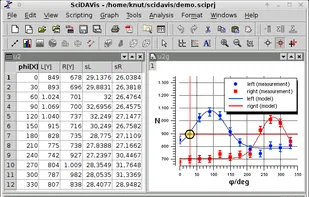
Open source framework for numerical computations and advanced statistical analysis, featuring nonlinear curve fitting, ODE solving, 1D/2D publication-quality visualization, Fourier and wavelet transforms, intuitive syntax, and namespace-based code organization for research.


SciDAVis is a free application for Scientific Data Analysis and Visualization. It's an application aimed at data analysis and

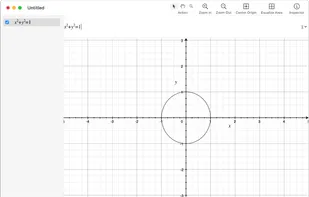
With Grapher, you can graph equations and data sets and visualize the results on your Mac in real time. Grapher displays algebraic relations, both implicit and explicit, in 2D and 3D. You can use a variety of coordinate systems and choose from a wide array of mathematical...


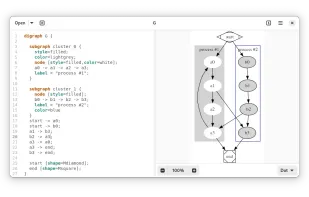
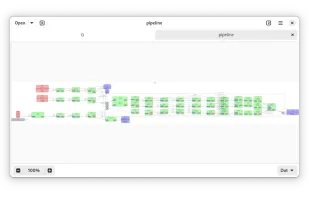
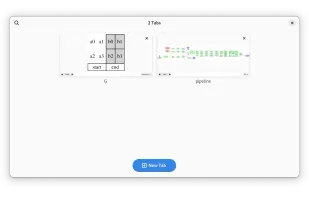
Delineate provides facilities to edit and draw graphs specified in the DOT language It is designed to be a simple and intuitive tool for creating and editing graphs, with a focus on the user experience.


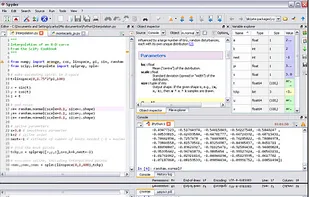
Python(x,y) is a free scientific and engineering development software for numerical computations, data analysis and data visualization based on Python programming language, Qt graphical user interfaces and .


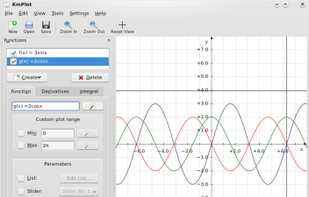
KmPlot is a powerful mathematical plotter KDE, capable of plotting multiple functions simultaneously and combining them into new functions.

Free online algebra calculator from GeoGebra: solve equations, expand and factor expressions, find derivatives and integrals