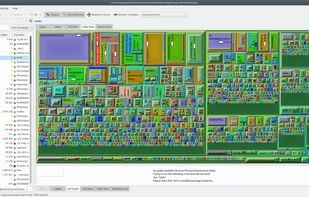
KCachegrind is a profile data visualization tool, used to determine the most time consuming parts in the execution of a program.
Cost / License
- Free
- Open Source (GPL-2.0)
Platforms
- Linux
- KDE Plasma
- Flathub


Massif-Visualizer is described as 'Massif Visualizer is a tool that - who'd guess that - visualizes massif data. You run your application in Valgrind with --tool=massif and then open the generated massif.out.%pid in the visualizer. Gzip or Bzip2 compressed massif files can also be opened transparently' and is an app. There are four alternatives to Massif-Visualizer for a variety of platforms, including Mac, Windows, Linux, Web-based and KDE Plasma apps. The best Massif-Visualizer alternative is KCacheGrind, which is both free and Open Source. Other great apps like Massif-Visualizer are Webgrind, WinCacheGrind and Profiling Viewer.
KCachegrind is a profile data visualization tool, used to determine the most time consuming parts in the execution of a program.
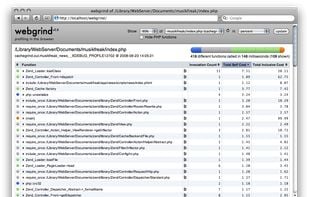
Webgrind is an Xdebug profiling web frontend in PHP5. It implements a subset of the features of kcachegrind and installs in seconds and works on all platforms.
WinCacheGrind is a viewer for cachegrind.out files generated by xdebug 2. WinCacheGrind is functionally similar to KCacheGrind, only it is much simpler and runs on Windows.

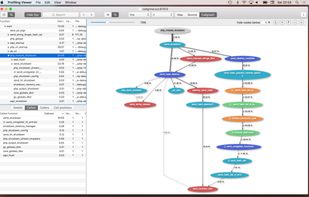
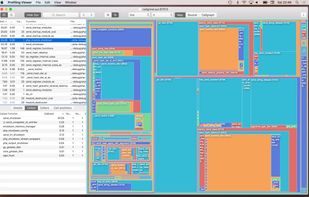
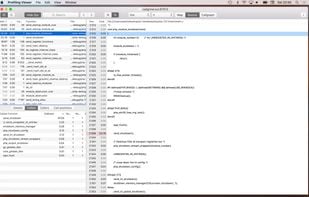
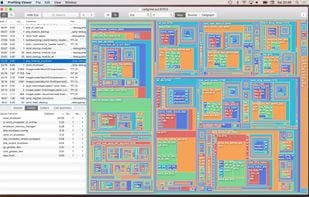
Profiling Viewer opens and visualizes callgrind files. You can use Treemap, Callgraph, flat or hierarchic lists to identify functions where your application spends more time than expected.