
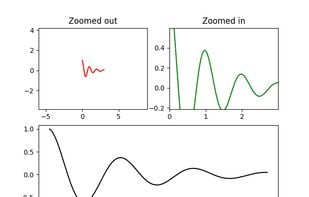
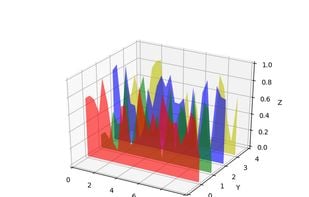
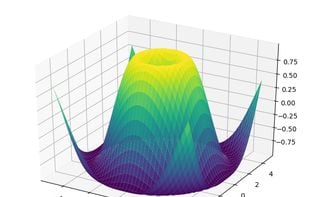
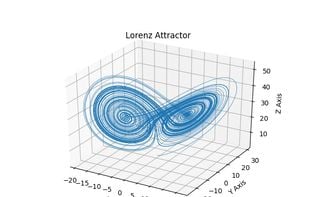
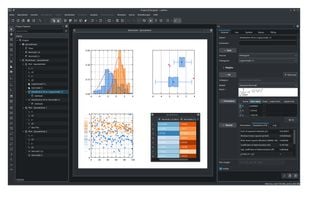
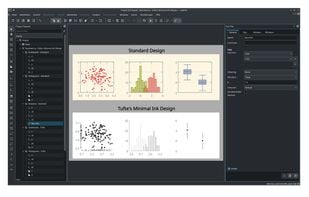
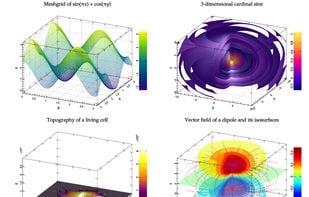
Matplotlib is a comprehensive library for creating static, animated, and interactive visualizations in Python. Matplotlib makes easy things easy and hard things possible.
Cost / License
- Free
- Open Source
Platforms
- Mac
- Windows
- Linux
- Python
- BSD
+1


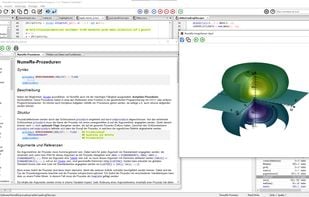
pro Fit is described as 'The best curve fitting, regression, plotting, data analysis for macOS. Python and LaTeX support, publication quality plots' and is an app in the development category. There are more than 25 alternatives to pro Fit for a variety of platforms, including Windows, Mac, Linux, Web-based and Flathub apps. The best pro Fit alternative is Matplotlib, which is both free and Open Source. Other great apps like pro Fit are GnuPlot, LabPlot, OriginPro and Julius.
Matplotlib is a comprehensive library for creating static, animated, and interactive visualizations in Python. Matplotlib makes easy things easy and hard things possible.
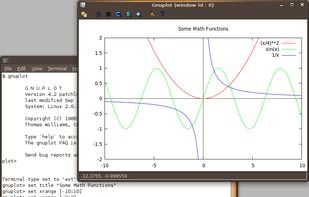
Gnuplot is a portable command-line driven interactive data and function plotting utility. It was originally intended as to allow scientists and students to visualize mathematical functions and data. It does this job pretty well, but has grown to support many non-interactive...


LabPlot is a free, open source and cross-platform Data Visualization and Analysis software accessible to everyone and trusted by professionals.

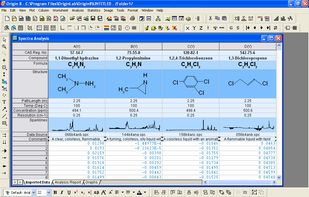
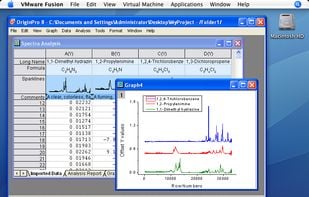
Data analysis and graphing software for scientists and engineers. It provides You with dozens of functionalities and options. The plotting engine is very effective and the plots are of high quality. A lot of statistical functionalities make data analysis very easy even for those...

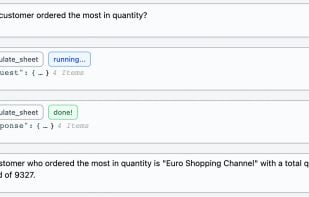
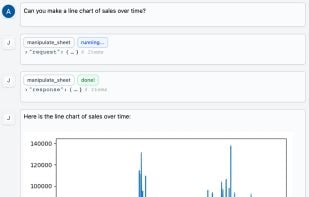
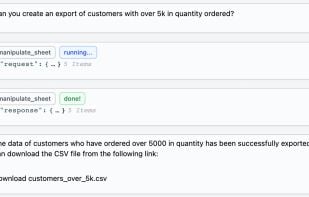
Julius AI is an advanced data analysis tool that leverages artificial intelligence to interpret, analyze, and visualize complex data sets, simplifying data analysis for individuals lacking expertise in data science or statistics.


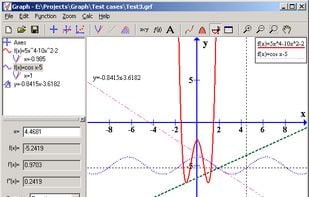
Graph is an open source application used to draw mathematical graphs in a coordinate system. Anyone who wants to draw graphs of functions will find this program useful. The program makes it very easy to visualize a function and paste it into another program.


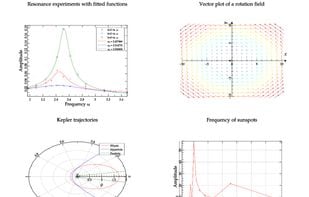
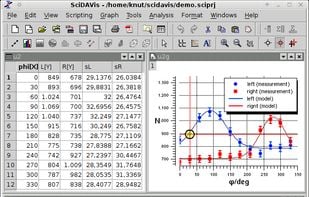
Open source framework for numerical computations and advanced statistical analysis, featuring nonlinear curve fitting, ODE solving, 1D/2D publication-quality visualization, Fourier and wavelet transforms, intuitive syntax, and namespace-based code organization for research.


SciDAVis is a free application for Scientific Data Analysis and Visualization. It's an application aimed at data analysis and


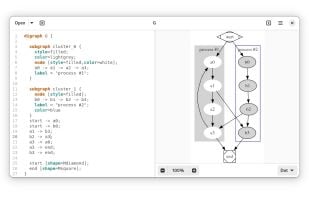
Delineate provides facilities to edit and draw graphs specified in the DOT language It is designed to be a simple and intuitive tool for creating and editing graphs, with a focus on the user experience.

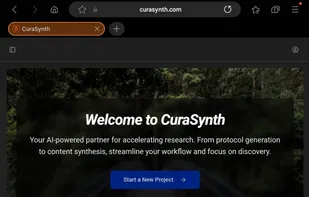
Curasynth is an AI-powered research platform designed to streamline and automate various aspects of academic and clinical research, from writing and data analysis to protocol generation. It provides an all-in-one platform for researchers to increase efficiency and reduce the...

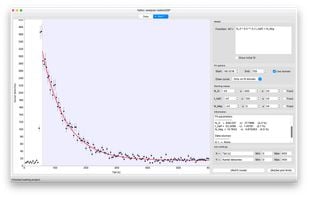
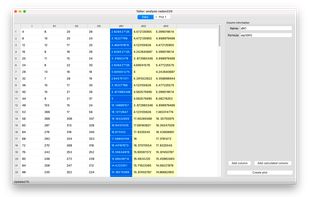
Tailor is an application for data analysis and curve fitting. You can fit custom models to your data, simply by entering the mathematical expression and choosing suitable initial values. The application is tailored to giving you an intuitive interface for entering or inspecting...


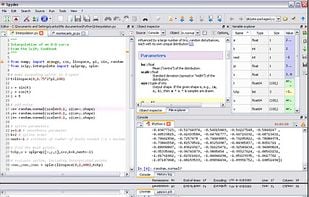
Python(x,y) is a free scientific and engineering development software for numerical computations, data analysis and data visualization based on Python programming language, Qt graphical user interfaces and .