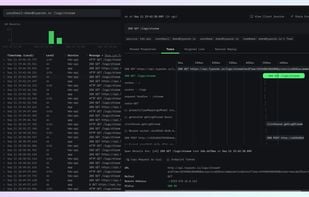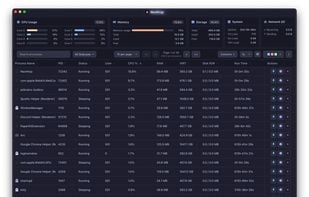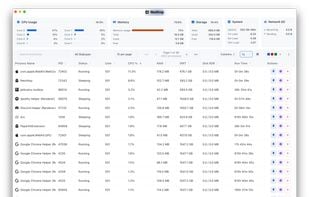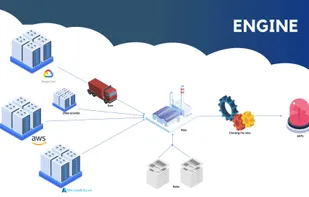

Pachtop is a lightweight, performant, and opensource system monitor that provides real-time monitoring of your system's performance, application monitoring, and detailed system information. Built with Rust and Tauri


Best alternatives are  Process Explorerand
 htop
htop
58 alternativesProcess Explorerandhtop