





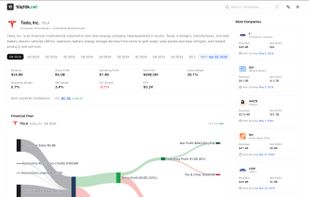
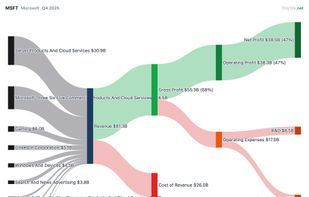
10q10k.net provides visual financial analysis for S&P 500 companies. Each company page features an interactive Sankey diagram that shows the flow of money from revenue through expenses to profit, making it easy to understand where companies make and spend money.
Cost / License
- Free
- Proprietary
Platforms
- Online
- Global




+1


 Germany
 EU
EU


 United States


 Spain
Spain


 Israel








 Australia


 Singapore


