Bleemeo is a cloud-based infrastructure monitoring platform that gives engineering teams full visibility into their servers, containers, Kubernetes clusters, and applications — without the complexity of building and maintaining a monitoring stack.
The problem Bleemeo solves: Most monitoring tools force you to choose between spending weeks configuring an open-source stack (Prometheus, Grafana, Alertmanager, Thanos) or paying unpredictable enterprise prices (Datadog, New Relic). Meanwhile, legacy tools like Nagios and Zabbix require manual configuration for every service and server. For growing teams without a dedicated observability team, none of these options work well.
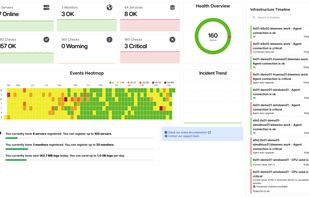
How it works: Install Glouton, our lightweight open-source agent (Apache 2.0), on your servers or Kubernetes clusters with a single command. The agent automatically discovers every running service — databases, web servers, caches, message queues, containers — and starts collecting metrics at 10-second resolution. Dashboards and smart alert rules activate instantly. No configuration files to write, no exporters to manage, no dashboards to build from scratch. When your infrastructure changes, Bleemeo adapts automatically.
What's included: Real-time dashboards, AI-powered anomaly detection, centralized log management, uptime monitoring from 7 global locations, full PromQL query support, native OpenTelemetry (OTLP) ingestion, 13 months of data retention, mobile apps for iOS and Android, and integrations with Slack, PagerDuty, Microsoft Teams, OpsGenie, and webhooks.
Pricing: Simple per-host pricing with no charges per metric, per container, or per GB of logs. A free plan covers up to 3 servers permanently. A 15-day trial gives full access to all features with no credit card required.
European company: Bleemeo is based in Toulouse, France. All data is stored exclusively in EU data centers, encrypted with TLS 1.3 in transit and AES-256 at rest. GDPR compliant by design.
Open-source agent: Glouton is fully open-source. No black box, no proprietary data collection. Audit the code, contribute, or run it independently.
Standards-based: Full Prometheus compatibility (PromQL, exporters, remote write) and native OpenTelemetry support mean no vendor lock-in. Your instrumentation stays portable.
Best for: CTOs, DevOps engineers, and SREs at startups, scale-ups, and SMBs who need production-grade monitoring without spending engineering time maintaining it. Teams typically go from zero to full monitoring in under 5 minutes and spend less than 30 minutes per month on their monitoring after setup.



 EU
EU


 lporcheron added Bleemeo as alternative to Better Stack
 simpleobservability added Bleemeo as alternative to Simple Observability


 Bleemeo