Every air quality app reports the same number to everyone. The AQI blends several pollutants into one score, which hides whichever one is actually high — so a "moderate" day can be fine one week and hard to breathe the next.
Breathing Index works the other way round. It takes the index apart, and then learns from you which parts of it matter to you.
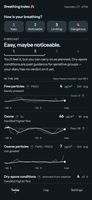
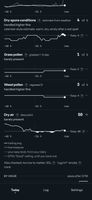
It breaks the air into its measurements: fine particles, coarse particles, ozone, sulphur dioxide, wildfire smoke, mold, dew point, and pollen separated by plant — trees, grasses and weeds named individually. Each is its own row with its own 48-hour trace.
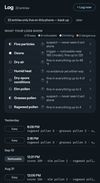
You rate your breathing on four levels: Easy, Noticeable, Limiting, Dangerous. Each rating is stored with the complete set of air readings for that moment. As the log grows, the app compares your own easy days against your own hard days, variable by variable, and marks the ones your history implicates. Pollen may matter to you and ozone may not; for someone else it is reversed. It then tells you how today's air compares to the days you have already logged, on a scale from 1 (Easy) to 4 (Dangerous) — built from your entries, not from a population average.
It is not limited to one city or country. Pollutant readings come from the Open-Meteo forecast model wherever you are, and from EPA AirNow monitoring stations in the United States when one is close enough to use instead.
It is a progressive web app: it runs in any browser and installs to the home screen on Android and iOS. There is no account, no payment and no advertising. The diary is stored on your own device and is never uploaded. The source is published under the Apache 2.0 licence.
It is not a medical device, and it does not predict your day.








 Drew-Hoover added Breathing Index as alternative to IQAir AirVisual, AQI, Plume Labs and World Air Quality Index
 Drew Hoover

