KeyLines Graph Visualization Toolkit Alternatives
KeyLines Graph Visualization Toolkit is described as 'KeyLines is a JavaScript toolkit used by developers to build powerful network visualization applications, quickly' and is a Diagram Editor in the development category. There are more than 25 alternatives to KeyLines Graph Visualization Toolkit for a variety of platforms, including Web-based, Windows, Self-Hosted, Mac and Linux apps. The best KeyLines Graph Visualization Toolkit alternative is Gephi, which is both free and Open Source. Other great apps like KeyLines Graph Visualization Toolkit are Graphviz, Penrose, Graphs and ikolinks.
Alternatives list

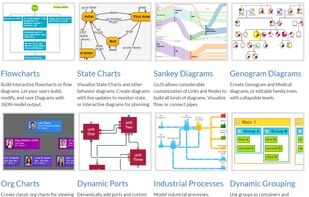
GoJS is a feature-rich JavaScript library for implementing interactive diagrams across modern browsers and platforms. GoJS makes constructing diagrams of complex Nodes, Links, and Groups easy with customizable templates and layouts.
Cost / License
- Paid
- Proprietary
Platforms
- Self-Hosted
- JavaScript
 United States



Cost / License
- Free
- Open Source
Application type
Platforms
- Self-Hosted
- React
 R
R
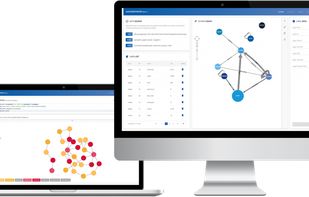
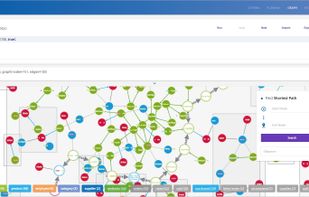
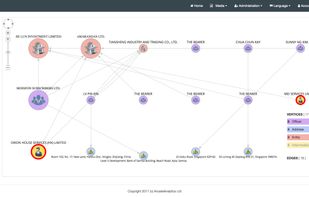
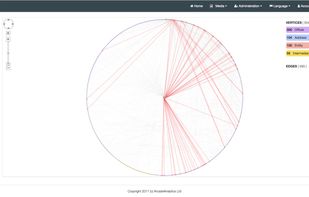
AgensBrowser is a web interface for AgensGraph to visualize and manage graph data. AgensBrowser offers the interactive visualization of graphs and enables you to query and modify graph data using Cypher and SQL on the web.
Cost / License
- Paid
- Proprietary
Platforms
- Self-Hosted
- Java


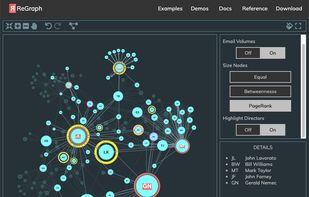
ReGraph is a React toolkit for developers to add powerful, interactive graph data visualizations to their applications quickly and easily.
Cost / License
- Paid
- Proprietary
Platforms
- Mac
- Windows
- Linux
- Online
- Self-Hosted
 United Kingdom


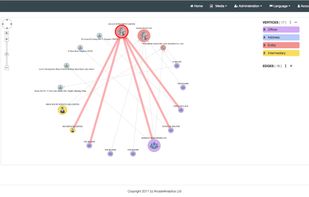
Arcade Analytics is the easy-to-use graph visualization tool that lets you quickly transform your data into vibrant and engaging visual formats.
Cost / License
- Freemium
- Proprietary
Platforms
- Online
 Italy
Italy EU
EU


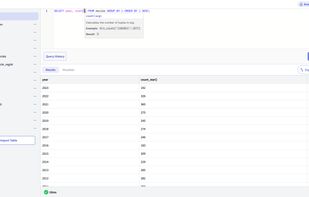
TextQuery is a desktop app that lets you import data file as a table, query it using SQL, and create stunning charts from those results.
Cost / License
- Freemium
- Proprietary
Platforms
- Mac
- Windows


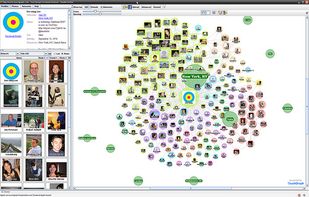
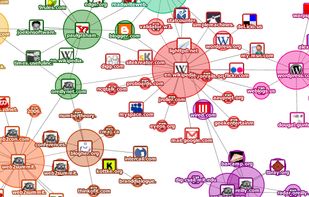
TouchGraph is the producer of data visualization software TouchGraph Navigator 2. With TouchGraph Navigator 2, users can upload data and create "interactive network visualizations."[1] Users can purchase licenses for either a TouchGraph Navigator Desktop version or...
Cost / License
- Paid
- Proprietary
Platforms
- Windows
- Linux



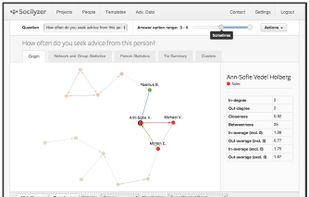
Web-based tool for conducting a social network analysis: from data collection to graph visualization and analysis.
Cost / License
- Freemium
- Proprietary
Application type
Platforms
- Online
 Denmark
- EU


Cost / License
- Free
- Open Source
Platforms
- Self-Hosted


Ember Charts is a charting library built with the Ember.js and d3.js frameworks. It includes time series, bar, pie, and scatter charts which are easy to extend and modify. The out-of-the-box behavior these chart components represents our thoughts on best practices in chart...
Cost / License
- Free
- Open Source
Platforms
- Self-Hosted
- United States