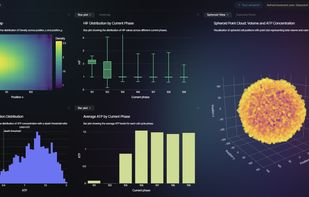
Nveil is a generative visualization platform that lets anyone transform raw data into beautiful, interactive charts, dashboards, and data stories just by describing what they want.
Upload a CSV, connect your database, or paste a table. Nveil's AI understands your data, suggests the most effective visual encodings, and generates fully customizable, publication-ready visualizations in seconds. No more wrestling with chart libraries, fighting template limitations, or waiting on a data team to build something the business can actually use.
What makes Nveil different:
Generative, not templated, every visualization is built from scratch to fit your data and story, not pulled from a fixed chart gallery.
Natural language interface, ask for "a revenue waterfall by region with YoY deltas" and get it. Iterate by talking to the chart.
Design-grade output, charts that look like they came from a top-tier design studio, ready for decks, reports, blogs, or embedding.
Interactive by default, tooltips, filters, drilldowns, and animations without writing a line of D3 or JavaScript.
Export anywhere, PNG, SVG, interactive HTML, or embed directly into Notion, Slack, web pages, and presentations.
Who it's for: analysts tired of fighting Tableau formatting, marketers who want charts that match the brand, founders building investor decks, journalists and researchers telling data-driven stories, and any team that needs to go from data to insight without a week of BI work.