


NVivo
6 likes
Software for qualitative data analysis in every setting - from market research to content analysis and evaluation. QSR International’s products: XSight and NVivo are designed to help researchers and other people analyzing audio, video, photos, Word documents and PDF documents to...
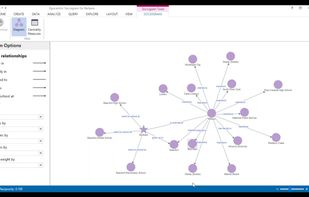

Cost / License
- Pay once
- Proprietary
Platforms
- Windows


Features
NVivo News & Activities
Highlights All activities
Recent News
No news, maybe you know any news worth sharing?
Share a News TipRecent activities
 gchavez added NVivo as alternative to Mixed Measures
 jaisal added NVivo as alternative to Lattice QDA
 buttercloud added NVivo as alternative to Statspresso
 fablesenseai added NVivo as alternative to FableSense AI


NVivo information
Developed by
UnknownLicensing
Proprietary and Commercial product.Pricing
One time purchase (perpetual license).Alternatives
36 alternatives listedBadge
Get an embeddable badge for NVivoSupported Languages


Comments and Reviews
ATLAS.ti now has a cloud-based version.
• QDA Miner is a software that enable you to manually coding text and images, annotating, retrieving, and analyzing coded segments. • It can handle large collections of documents and images • Numerical, categorical, and date variables can also be associated with each case • Codebooks consist of codes organized hierarchically • Coding a document is simple. You just have to select the text segment that you would like to code • Then drop the code on the highlighted segment. • Code marks in the document margin indicate the location of a code • Codes may also be assigned by double-clicking them • Codes can overlap each other • Notes and comments may also be attached to the code marks • QDA Miner offers various tools to speed up the coding process • It can search all documents for specific key words or key phrases • And extract sentences, phrases and documents matching the search expression • QDA Miner displays the search result in a table format. • A code can be assigned to all retrieved segments by selecting it from this list box... • And then by clicking this button • One may also code a single segment by using this button. • QDA Miner also offers other types of search tools like a powerful Query-by-Example and a Section Retrieval tool. • Once the coding is complete, QDA Miner can retrieve all text segments associated with specific codes • You can retrieve segments associated with one or several codes. • One can also create complex search expressions and retrieve segments that overlap or that are in or near other codes. • Segments are presented in a table format • You may also display them in text format by clicking this button • QDA Miner can perform various statistics on the coding. Let’s start with simple coding frequency. • To chart this data, simply select the rows you would like to display... • ...and click this button (graphics) • Code segments associated with a chart section can be retrieved easily • QDA Miner also allows one to examine the relationship between codes and values of numerical and categorical variables. • Here we look at how often codes are associated with different candidates... • ...and display graphically some of these differences. • Another way to display the data graphically is using bubble charts. • Bubble charts present frequencies using circles of different diameters • Many features of this chart can be customized to highlight specific findings • One can also retrieve specific text segments directly from bubble charts. • Correspondence analysis provides a very useful way to identify relationships between codes and variables. • Heatmaps are another useful visualization technique • Relative frequencies are represented using brightness of colors. • Columns and rows are clustered, allowing one to identify relationships between codes and subgroups of individuals. • Coding retrieval may also be performed straight from the heatmap by selecting a cell region... • ...and clicking the search button • QDA Miner also offers tools to examine the co-occurrence of codes. • Let’s find codes appearing near each other within a distance of 5 paragraphs or less • The dendrogram shows clusters of codes that tend to appear near each other. • You can search for these co-occurrences by selecting a cluster and clicking this button. • Multidimensional scaling plots also represent graphically the co-occurrences of codes, either on 2-D or 3-D. • The strength of relationships may also be displayed by clicking this button. • Proximity plots are also very useful to examine codes that are associated with a specific code. • To retrieve text segments associated with a specific pair of codes, select a code and click this button. • The same tools may be used to analyze the similarity of cases, such as dendrograms, 2-D and 3-D multidimensional scaling plots and proximity plots. • You may also access the underlying statistics. • Tables may be printed or saved to disk.