




ChartAnimator
1 like
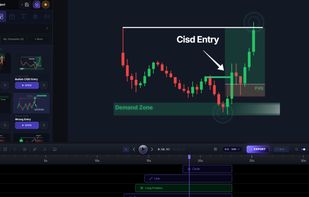
ChartAnimator is candlestick chart animation software built specifically for traders, financial educators, and market analysts who need to turn chart analysis into high-quality video content, without learning motion graphics software.

Cost / License
- Freemium (Subscription)
- Proprietary
Platforms
- Online


Features
ChartAnimator News & Activities
Highlights All activities
Recent activities
- sethcollett A comment was removed from ChartAnimator
- sethcollett liked ChartAnimator
- sethcollett updated ChartAnimator
- POX updated ChartAnimator
- sethcollett added ChartAnimator
 sethcollett added ChartAnimator as alternative to Wondershare Filmora, Adobe Premiere Pro, CapCut and Shotcut
ChartAnimator information
Developed by
 ChartAnimator
 Licensing
Proprietary and Freemium product.Pricing
Subscription ranging between $29 and $69 per month + free version with limited functionality.Alternatives
40 alternatives listedBadge
Get an embeddable badge for ChartAnimatorSupported Languages


No comments or reviews, maybe you want to be first?